CROSS-FUNCTIONAL FACILITATION
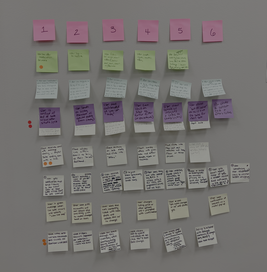
The Listing Manager Design Sprint was a four-day effort, two days with stakeholders and two days prototyping and testing, aimed at improving Manheim’s Listing Manager product. The goal was to give sellers better access to real-time sales data and more control over their inventory management process.
The project was a focused innovation initiative aimed at improving how sellers interact with and control vehicle inventory. The product existed on a legacy platform, had grown increasingly complex, and user frustrations with inactive listings, unclear stats, and limited configurability were impacting usability and satisfaction.
I used a structured Google Design Sprint framework to rapidly explore, validate, and prototype solutions that could inform future product enhancements. The process included deep dives into current pain points and rapid co-creation of ideal-state experiences.
I organized and led the design sprint, guiding an executive/VP-level cross-functional team through structured innovation and validation. I facilitated the workshop activities, led the design of a high-fidelity prototype, and organized usability testing with real users across different dealer types.
The Design Sprint is essentially a 4-day intense hackathon. On Day 1 we define the challenges and scope of the week. Day 2 is about deciding what challenges to prototype. Day 3 is about rapidly building the high-fidelity prototype, which is then tested with real users on Day 4.
The outcome of every Design Sprint Week is an interactive prototype, tested by real users, and with clear insights on where to go next. This is not a “wireframe” or a “paper prototype”, it looks and feels like a real product.
Once we have a tangible representation of the product, and real user insights to guide our next steps, making decisions becomes a lot easier. You could use a second sprint to iterate and polish the idea, bringing it very close to production-ready, or you could use the prototype to sell the idea further and develop the concept.
Active/Inactive Listings Tab
Reframed logic behind inactive listings with clearer visual cues and explanations, reducing confusion and support tickets.
Performance Metrics Panel
Introduced toggle between value and percentage, plus filtering by location, helping users derive context-specific insights.
Live Listing Stats
Streamlined layout to reduce clutter, surface key data points (e.g., first listed date, days on market).
Offer Management
Redesigned workflows for accepting, countering, and rejecting offers based on direct user feedback.
Vehicle-Specific Stats
Showcased key metrics like “times run” and “visibility score” to empower smarter inventory decisions.
Customizable Dashboards
Let users configure layouts based on their role or priorities.
Clearer Terminology
Aligned labels and actions more closely with user expectations and mental models.
Tooltips & Data Views
Introduced contextual tooltips and toggles for percentage/value views to reduce onboarding time and cognitive load.